Dagem Yilma Chernet1*, Levi Klassen1*, Sonya Goertzen1, and Juan Nicolas Malagon1§
1Canadian Mennonite University, 500 Shaftesbury Blvd, Winnipeg, MB, Canada R3P 2N2
§Correspondence to: Juan Nicolas Malagon (NMalagon@cmu.ca)
* Authors have equal contribution
Abstract
Description
Methods
Reagents
Extended Data
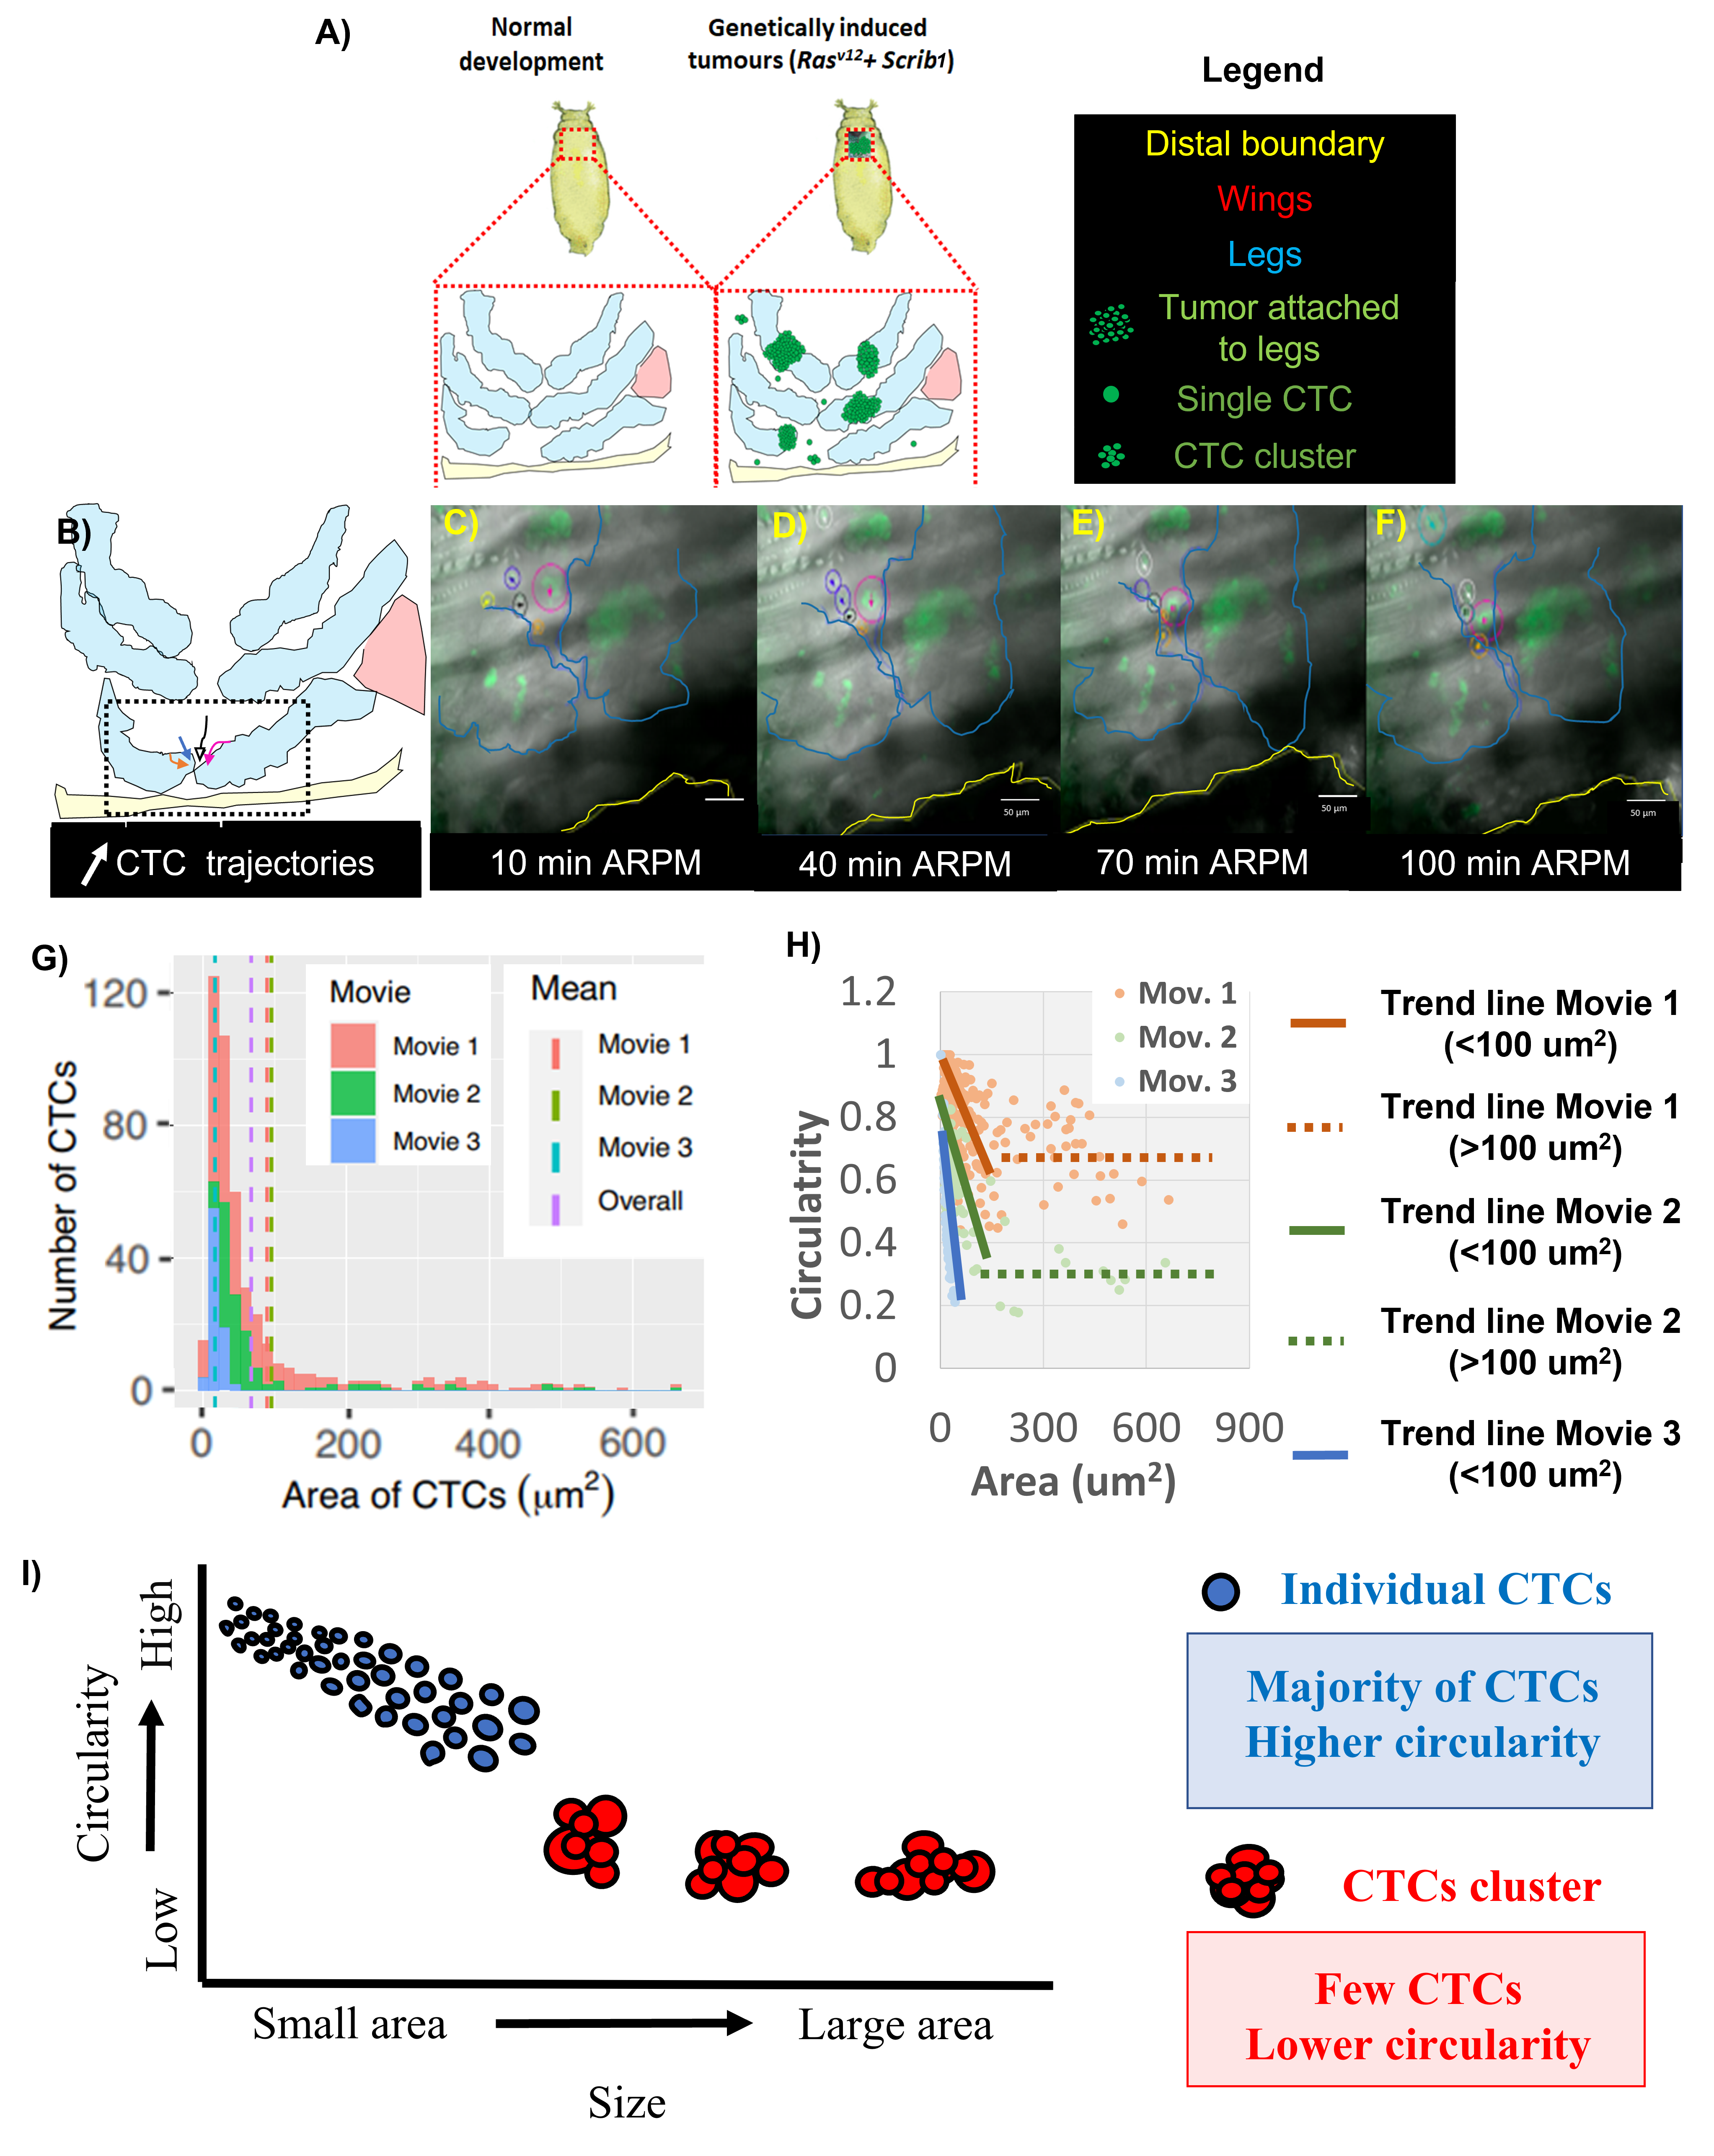
- Description: Movie 1. 2-Dimensional confocal projections showing circulatory tumors cells (CTCs) during early Drosophila pupal leg and wing development. Schematic (A) and 2D projections (B-D) show the movement of CTCs during morphogenesis. Panel A shows schematically the region imaged (dotted line). Panel B shows only the green channel, where invasive tumor cells are marked with GFP. Panel C shows a composite of the green and DIC channels. This panel, in addition to showing tumor cells, also allows for observing the developing legs and wings. Panel D shows the composite of the green and DIC as well as various labels that allow for the direction of CTCs to be observed. CTCs are labelled within circles of various colors. Arrows indicate the direction of CTC movement. Sections of developing leg are labelled with blue lines. The distal boundaries of leg and wing imaginal discs are labelled with yellow lines.. Resource Type: Dataset. DOI: 10.22002/D1.20190
- Description: Movie 2. 2-Dimensional confocal projections showing circulatory tumors cells (CTCs) during early Drosophila pupal leg and wing development. 2D projections (A-B) showing the movement of CTCs during morphogenesis. Panel A shows only the green channel, where invasive tumor cells are marked with GFP. Panel C shows a composite of the green and DIC channel. CTCs are labelled within circles of various colors. Arrows indicate the direction of CTC movement. . Resource Type: Dataset. DOI: 10.22002/D1.20191
- Description: Movie 3. 2-Dimensional confocal projections showing circulatory tumors cells (CTCs) during early Drosophila pupal leg and wing development. 2D projections (A-B) showing the movement of CTCs during morphogenesis. Panel A shows only the green channel, where invasive tumor cells are marked with GFP. Panel C shows a composite of the green and DIC channel. CTCs are labelled within circles of various colors. Arrows indicate the direction of CTC movement. . Resource Type: Dataset. DOI: 10.22002/D1.20192
Acknowledgements
Funding
Author Contributions
- Dagem Yilma Chernet: Conceptualization, Investigation, Writing - original draft, Writing - review & editing, Data curation, Formal analysis
- Levi Klassen: Data curation, Formal analysis, Methodology, Writing - original draft, Writing - review & editing, Investigation
- Sonya Goertzen: Investigation, Data curation, Formal analysis
- Juan Nicolas Malagon: Data curation, Formal analysis, Writing - review & editing, Investigation, Supervision, Funding acquisition
Reviewed By
Jacob Kagey
Nomenclature Validated By
FlyBase Curators
History
- Received: 11/3/2021
- Revision Received: 5/30/2022
- Accepted: 6/9/2022
- Published Online: 6/10/2022
- Indexed: 6/23/2022
Copyright
© 2022 by the authors. This is an open-access article distributed under the terms of the Creative Commons Attribution 4.0 International (CC BY 4.0) License, which permits unrestricted use, distribution, and reproduction in any medium, provided the original author and source are credited.
Citation
PubMed Central: 9242741
PubMed: 35783574
microPublication Biology is published by
1200 E. California Blvd. MC 1-43 Pasadena, CA 91125
The microPublication project is supported by

The National Institute of Health -- Grant #: 1U01LM012672-01